IoT Temperature Monitoring
A Raspberry Pi-based system for monitoring temperature with DS18B20 sensors, email alerts, InfluxDB storage, and a Grafana dashboard.
Technologies Used
Context
What to do when your refrigerator seems to be not working correctly?
Calling your landlord? Certainly. But in a nerdy way, where you also wanted to learn IoT and Raspberry Pi microcomputer?
Well, then you build a fully-fledged IoT monitoring system, which will give you concrete numbers to confirm your observations.
Solution
What I created turned out to be a complete IoT monitoring system (a simple one, but complete).
The temperature sensors were running all the time, 24/7, saving the temperature every few seconds, assuring good accuracy. Then the data would be saved in batches, while at the same time e-mail alerts were sent if the temperature has exceeded accepted thresholds.
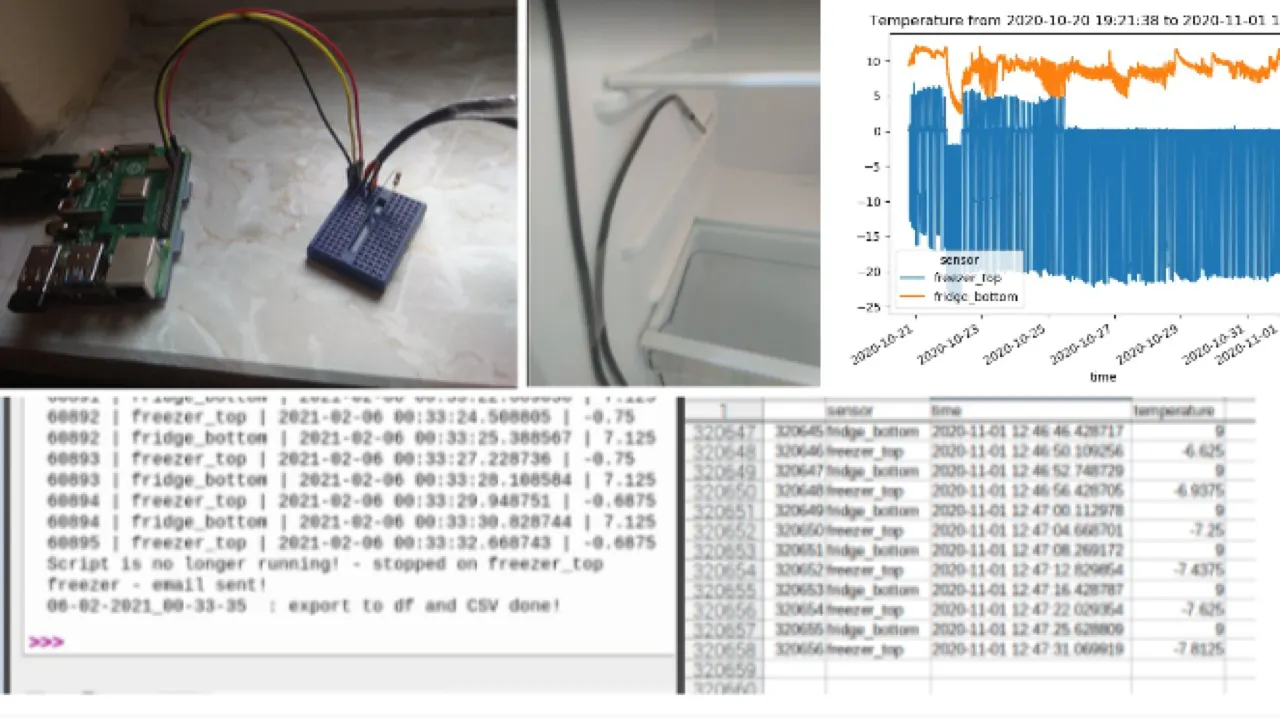
Hardware Setup
- Raspberry Pi 4B as the central controller
- DS18B20 temperature sensors (2 units)
- One for the fridge compartment
- One for the freezer
- Breadboard for sensor wiring
Key Features
Continuous Monitoring
- 1-second polling intervals, so with some hardware delay the data would be retrieved every four seconds on average
- Handling two sensors by retrieving their unique IDs
- Covering an outage, issues with getting sensor data, by e-mail notification
Data Persistence
- CSV and chart exports every 10,000 readings (can be configured differently)
- Automatic export on script crash
- Timestamped filenames
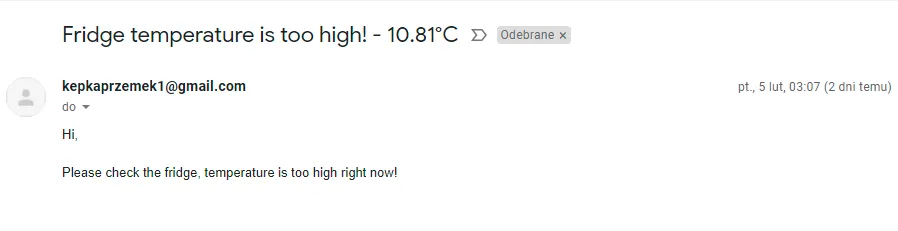
Intelligent E-mail Alerting
- Temperature thresholds: Fridge >10°C, Freezer >-10°C (could be easily set for any values)
- Rate limiting: Maximum 1 email per sensor every 6 hours
- Script failure notifications
- Gmail SMTP integration
Technical Evolution
Phase 1: MVP
So the first version, described above, was fully functional and working well.
- But it was operating fully on CSV files saved locally on the computer. So even if storage space would be no issue, then still after some period of time the computer would be flooded by so many extract files (or I would have huge files if changing the export frequency)
- Similarly with charts, it wasn’t a flexible solution, just generating them only for the current run
Hence I’ve decided that I should attempt an overhaul, that would be more “production-grade”.
Phase 2: Production Enhancement
So the enhanced version added professional monitoring:
- InfluxDB, running locally, for time-series storage
- Grafana for real-time dashboards
- Batch processing similarly as with CSV files, here to reduce DB operations
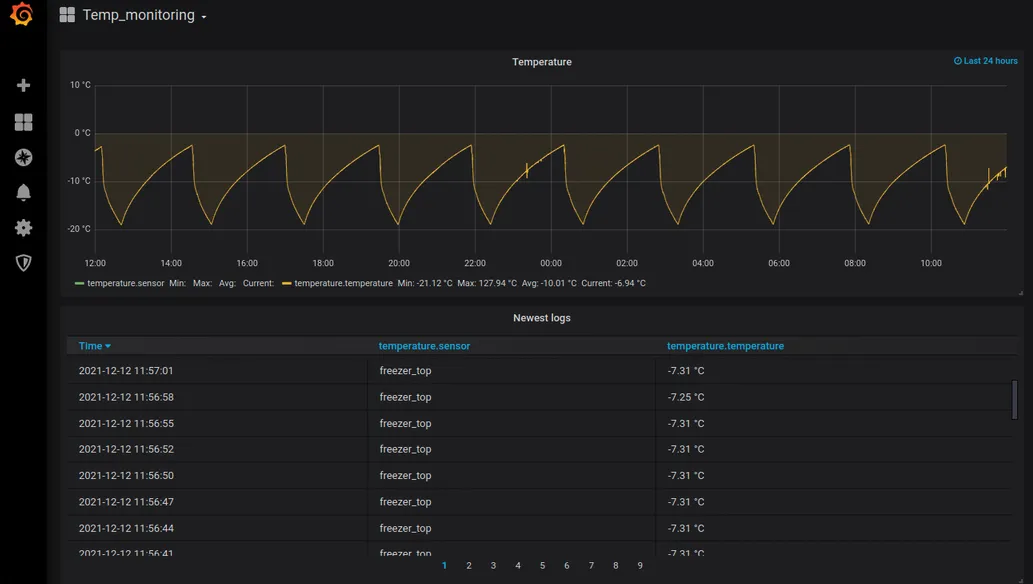
It didn’t add complexity - quite the opposite. The Python script became simpler because the complexity was handled by established solutions: InfluxDB and Grafana.
The data was now stored in a single InfluxDB table - no more scattered files.
And with Grafana, I didn’t need to generate charts programmatically. I could create and customize them directly in the UI.
Real-world Application
So in this case it was my personal application of IoT monitoring, but in a business setting the process would be more or less the same:
- Retrieving the data from a device (could be anything, and way more of them)
- Saving the data (files, database, we could also send the data to some server or to the cloud)
- Monitoring the data and getting the insights
Professional Takeaways
- This project set me up for being able to work within the IoT realm, starting from as far as setting up the hardware
- But it’s not only limited to IoT, as in general it has exposed me to real-time data retrieval and monitoring
- And additionally, using Raspberry Pi microcomputer has forced me to learn a little bit more on the infrastructure side, managing the system myself and using terminal as well